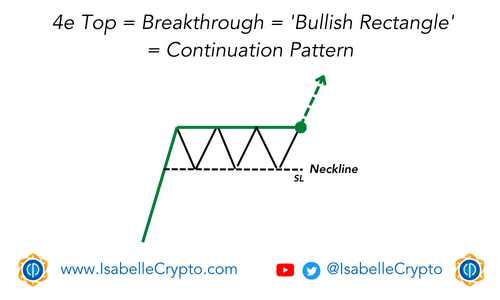
The “bullish rectangle” is a chart pattern in technical analysis that appears on price charts of financial assets. It is a bullish continuation pattern that is formed by two horizontal trendlines that bound a price consolidation phase between a support level and a resistance level.
The pattern is characterized by a series of price movements that oscillate between these two trendlines, forming a rectangle shape. The support line is formed by connecting two or more price lows, while the resistance line is formed by connecting two or more price highs.
The bullish rectangle pattern is considered a bullish continuation pattern because it typically occurs in an uptrend and indicates that the bulls are taking a brief pause before resuming the uptrend. Traders typically look for a breakout above the resistance line as a signal to buy the asset, with a price target set at the height of the rectangle pattern added to the breakout price.
The bullish rectangle pattern is a relatively reliable pattern and is often used by technical traders to identify potential buying opportunities. However, like all chart patterns, it is not foolproof, and traders should always use other indicators and risk management techniques to minimize potential losses.