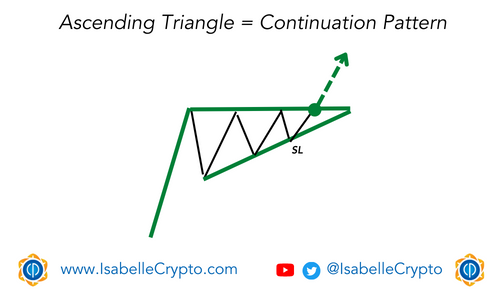
The ascending triangle is a bullish continuation chart pattern in technical analysis that occurs during an uptrend. The pattern is formed by two trendlines – a flat resistance line and a rising support line. The resistance line is formed by connecting two or more price highs, while the support line is formed by connecting two or more price lows.
As the price approaches the flat resistance line, it faces increasing selling pressure, resulting in a series of failed attempts to break above the resistance line. Meanwhile, the rising support line creates a floor for the price, preventing it from falling below a certain level.
The ascending triangle pattern is considered a bullish continuation pattern because it suggests that the bulls are gaining strength and are preparing to push the price higher. Traders typically look for a breakout above the resistance line as a signal to buy cryptocurrency coins, with a price target set at a distance equal to the height of the triangle added to the breakout price.
However, like all chart patterns, the ascending triangle is not 100% guaranteed. Traders should always use other indicators and risk management techniques to minimize potential losses.