The bearish rectangle is a chart pattern that appears in technical analysis of financial markets. It is a continuation pattern that typically forms during a downtrend, and it suggests that the price will continue to decline after a brief period of consolidation.
The pattern is formed by drawing two horizontal lines to create a rectangle that contains the price action. The upper line represents a resistance level, while the lower line represents a support level. The price then moves back and forth within this range, creating a series of tops and bottoms that are roughly equal in height.
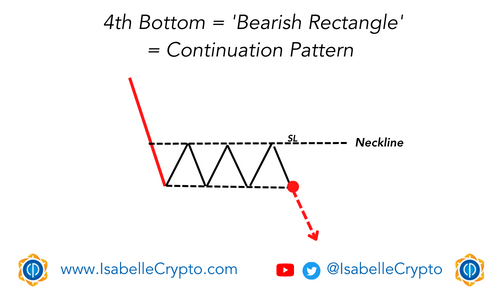
The bearish rectangle pattern is confirmed when the price breaks below the lower line of the rectangle, known as the “4th bottom breakthrough,” indicating that the bears have taken control and the downtrend is likely to continue. Traders often use this pattern as a signal to enter a short position, with a stop loss above the resistance level.