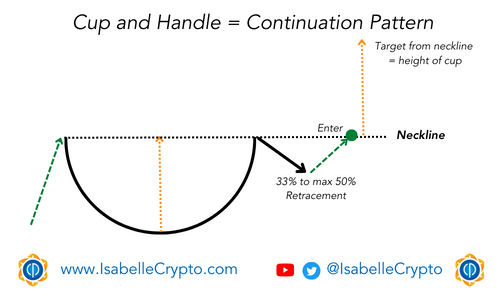
The cup and handle chart pattern is a technical analysis pattern that can be observed on the charts of cryptocurrencies as well as other financial assets. It is considered a bullish pattern that signals a potential continuation of an uptrend after a period of consolidation.
The cup and handle pattern consists of two parts: the cup and the handle. The cup is a u-shaped formation that typically lasts for several weeks to several months. During this time, the price of the asset gradually declines, forming the bottom of the cup. The decline is often accompanied by high trading volume.
Once the bottom of the cup has been reached, the price starts to rise again, forming the other side of the cup. This upward movement is often accompanied by lower trading volume compared to the volume of the decline. The peak of the cup is usually around the same level as the price before the decline started.
After the formation of the cup, there is usually a period of consolidation. This is known as the handle of the pattern, and it is typically shorter in duration than the cup.
The handle is a downward-sloping consolidation period, often marked by lower volume, which can form after the initial cup shape. It typically lasts for a few days or weeks, after which the price breaks out of the handle to the upside, signaling a potential continuation of the uptrend.
Traders and investors often look for this pattern as it can provide a signal for a bullish trend. However, it is important to note that no chart pattern is 100% guaranteed, and other factors such as market sentiment, news events, and overall market conditions can also impact the price of cryptocurrencies. It’s always best to use technical analysis patterns in conjunction with other forms of analysis to make informed trading decisions.