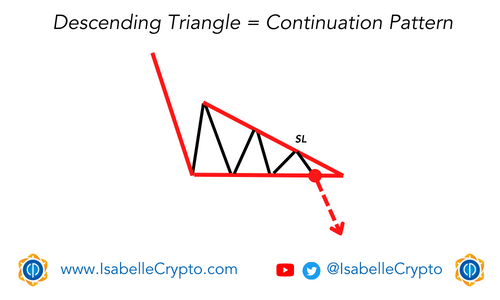
A descending triangle chart pattern is a technical analysis tool used by traders and investors to analyze the behavior of an asset’s price. This pattern is formed by drawing a diagonal line connecting the lower highs of the asset’s price and a horizontal line connecting the lows of the price. This creates a triangle shape that slopes downward.
The descending triangle chart pattern is typically seen as a bearish signal, indicating that the asset’s price is likely to continue its downward trend. Traders and investors use this pattern to make decisions on whether to buy, sell, or hold an asset.
Learning often happens in classrooms
but it doesn’t have to.