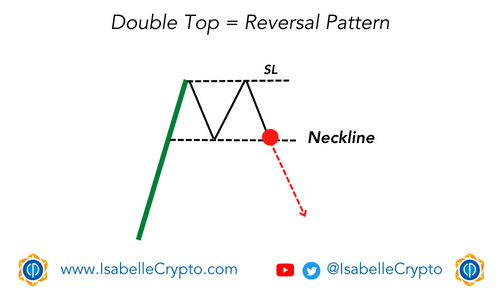
The double top pattern is a bearish reversal pattern commonly seen on price charts in technical analysis. It occurs when an asset’s price rises to a certain level, then falls back, and then rises again to the same level, forming two peaks that are roughly equal in height. The two peaks are separated by a dip, called the “trough,” which represents a failed attempt to break through the resistance level.
The pattern is complete when the price falls below the trough, breaking the neckline and confirming a trend reversal. This is often accompanied by an increase in trading volume as traders who previously bought the asset at the higher levels start to sell, leading to a decrease in demand and a subsequent drop in price.
The price target is often calculated by measuring the distance from the neckline to the highest peak and projecting that distance below the neckline.
The double top pattern is considered a strong bearish signal and is typically used by traders to take short positions or to sell their long positions. It is important to note, however, that no trading pattern is 100% guaranteed, and traders should always use other indicators and confirmations before making any trading decisions.