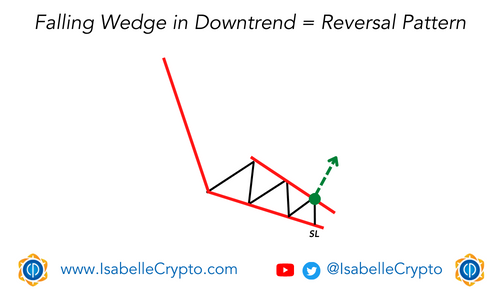
A falling wedge pattern is a technical chart pattern commonly observed in financial markets, including the crypto market. It is a bullish pattern that usually forms during a downtrend, indicating that the downtrend may be coming to an end, and a bullish reversal is imminent.
In a falling wedge pattern, the price of the asset is consolidating within a triangular shape that is formed by two converging trend lines sloping downwards. The upper trendline represents the resistance level, while the lower trendline represents the support level.
During a downtrend, the price of the asset usually makes lower lows and lower highs. However, as the price approaches the apex of the falling wedge pattern, the price action becomes narrower, and the volatility decreases. This indicates that the selling pressure is reducing, and the buyers may be stepping in.
A breakout above the upper trendline of the falling wedge pattern is usually considered as a confirmation of a bullish reversal. It suggests that the buyers have taken control of the market, and the price is likely to rise. The breakout should ideally be accompanied by a significant increase in trading volume to validate the bullish reversal.
In the crypto market, falling wedge patterns are commonly observed in various cryptocurrencies, and traders often use them to identify potential buying opportunities during a downtrend.
However, it is important to note that not all falling wedges may result in a bullish reversal, and traders should always consider other technical and fundamental factors before making trading decisions.