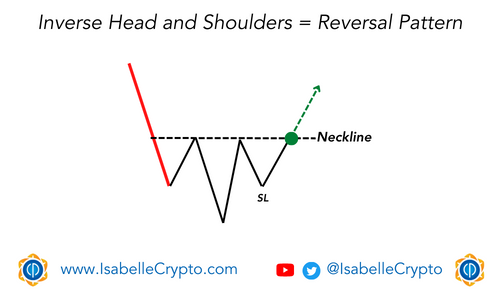
The inverse head and shoulders chart pattern is a technical analysis pattern that is used by traders to identify potential bullish reversals in the price of an asset. The pattern is named after its resemblance to a head and two shoulders, but upside down.
The pattern is formed by three troughs in the price of the asset. The first trough forms the left shoulder, the second trough is the head, and the third trough forms the right shoulder. The troughs are separated by two peaks, with the peak between the left shoulder and the head called the neckline.
The pattern is considered complete when the price breaks above the neckline after forming the right shoulder. This break is taken as a bullish signal by traders, as it suggests that the buyers have gained control of the market and the price is likely to continue to rise.
Traders often use other technical indicators, such as volume and momentum indicators, to confirm the pattern and increase the likelihood of a successful trade. They may also use stop loss orders to manage risk and protect against unexpected price movements.
It’s important to note that, like all technical analysis tools, the inverse head and shoulders pattern is not infallible and should be used in conjunction with other analysis methods to make trading decisions.