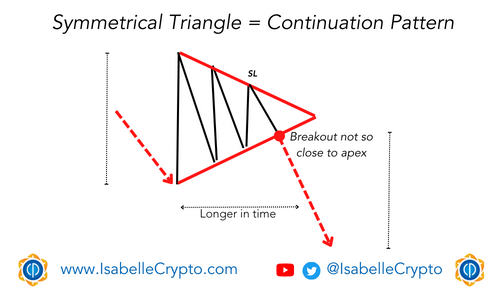
A symmetrical triangle is a technical chart pattern that forms when a cryptocurrency’s price consolidates within a triangular shape, with both the support and resistance lines converging toward each other. The pattern typically signals indecision among traders about the direction of the price.
In a downtrend, a symmetrical triangle pattern forms when the price of an asset creates lower highs and higher lows, and the support and resistance lines of the triangle converge toward each other.
As the price consolidates within the triangle, traders may interpret this as a temporary pause or a potential reversal of the trend. However, if the price breaks below the lower support line of the triangle, it is considered a bearish signal, suggesting that the downtrend is likely to continue. Conversely, a breakout above the upper resistance line may signal a potential reversal to the upside.
Overall, a symmetrical triangle in a downtrend suggests a period of consolidation and indecision among traders, with the potential for a breakout in either direction. However, in the context of a downtrend, a breakdown below the lower support line is the more likely outcome.