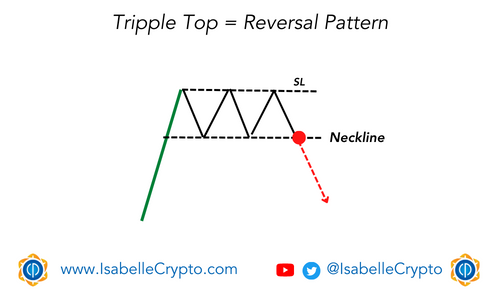
A triple top chart pattern is a bearish reversal pattern that forms on a price chart of an asset, such as a currency pair. It is characterized by three consecutive peaks that occur at approximately the same price level.
After the third peak, the price typically falls below the previous lows, signaling a potential bearish reversal.
Traders and analysts look for triple top patterns as they can indicate that buying pressure has become exhausted, and sellers may soon take control of the asset’s price. This may lead to an increase in selling interest and, as a result, a decline in the asset’s price.
Learning often happens in classrooms
but it doesn’t have to.